
The Filters and Transforms API was added to SciChart.js v2.x as a way to create derived data, filters, indicators or perform functions on your data easily and simply.
SciChart comes with a number of filters built-in. The Filters API can be used easily where you want to:
- Add a Linear Trendline to a chart
- Perform a Moving Average on an underlying DataSeries
- Offset and Scale a data-series
- Calculate the ratio of two DataSeries
- Apply a custom function to each datapoint, allowing you to do high-pass, low-pass or any other kind of filtering or per-point transformation
The Filters API is also extremely configurable and allow you to create custom filters - the possibilities of this API really are endless!
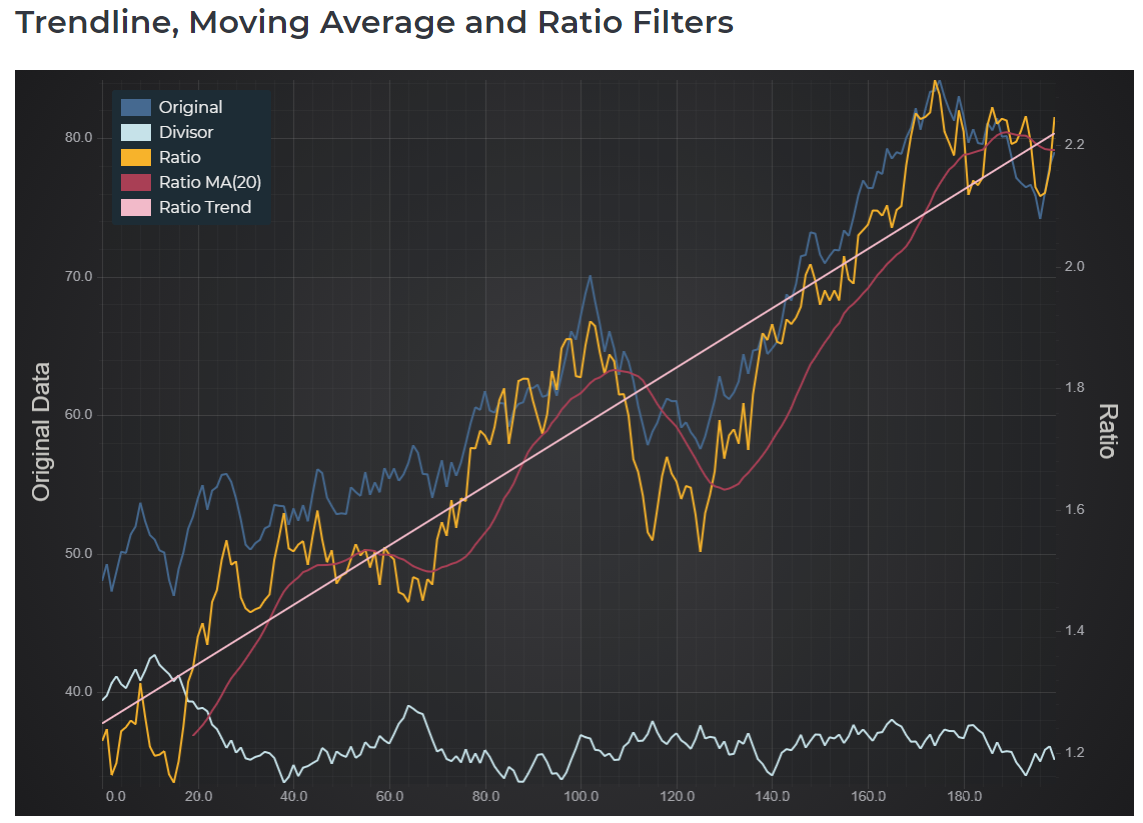
Above: See the Trendline, Moving Average and Ratio Filters example in the SciChart.Js.Examples
Filters Built-in to SciChart.js
For each kind of filter, there may be multiple types specific to the type of DataSeries that it will be attached to. These are listed below.
For example, a ScaleOffsetFilter which applies a scale (mutiplier) or offset (addition) to data series values has sub-types XyScaleOffsetFilter, XyyScaleOffsetFilter, XyzScaleOffsetFilter and OhlcScaleOffsetFilter - one for each type of dataseries.
All types apart from Ohlc accept any type of DataSeries as input. See [Specifying the Input field] below.
-
ScaleOffsetFilter - Applies a scale (multiplier) and an offset (addition) to each field value.
- XyScaleOffsetFilter
- XyyScaleOffsetFilter
- XyzScaleOffsetFilter
- OhlcScaleOffsetFilter
- XyLinearTrendFilter - Calculates a straight line best-fit for your dataseries.
- XyMovingAverageFilter - Calculates the moving average of your dataseries over the specified length.
- XyRatioFilter - Returns a series where each point is the ratio of the original series and the given divisorSeries.
-
CustomFilter - A class that allows you to create a simple custom filter by just specifying a filter function that will be applied to each data point.
- XyCustomFilter
- XyyCustomFilter
- XyzCustomFilter
- OhlcCustomFilter
Updating Data with Filters
The beauty of the Filters API is that when the underlying data updates, the filter automatically updates. There is no need to recalculate your filter - SciChart does this for you! Where possible, only the changed points are recalculated.
Daisy-Chaining Filters
Fitlers may be daisy chained or cascaded in order to combine their effects. Changing the underlying DataSeries will cause all filters in the chain to trigger an update.
Specifying the Input Field
An Xy filter will produce an XyDataSeries, but it can accept any series type as input. The options includes a [field] property of type EDataSeriesField, which determines which field on the original series will be the input. For Xyy filters there are yField and y1Field, and for Xyz filters there are yField and zField options. See the XyLinearTrendFilter page for an example.
Creating Advanced Custom Filters
One of the most powerful features of the Filters API is the ability to create custom filters.
To create an Advanced Custom Filter we simply override the FilterBase of the type of series we want ie (XyFilterBase, XyyFilterBase, XyzFilterBase, OhlcFilterBase). We must then override a few methods to perform the filtering.
The base class handles the field mapping in the getOriginalYValues method (and getOriginalY1Values for Xyy, and similar for the other types). See the CustomFilter page for more information or the online demo Realtime Aggregation using Advanced Custom Filter.
Filters API Demos
Several demos are included in our JavaScript Chart Examples Suite. Please find them below:
- Percentage Change using XyScaleOffsetFilter Example
- Ratio Filter with Chained Trend and Moving Average Example
- Realtime Aggregation using Advanced Custom Filter Example